Size of this preview: 650 × 492 pixels. Other resolutions: 317 × 240 pixels | 634 × 480 pixels.
Original file (650 × 492 pixels, file size: 36 KB, MIME type: image/png)
Summary
| Description |
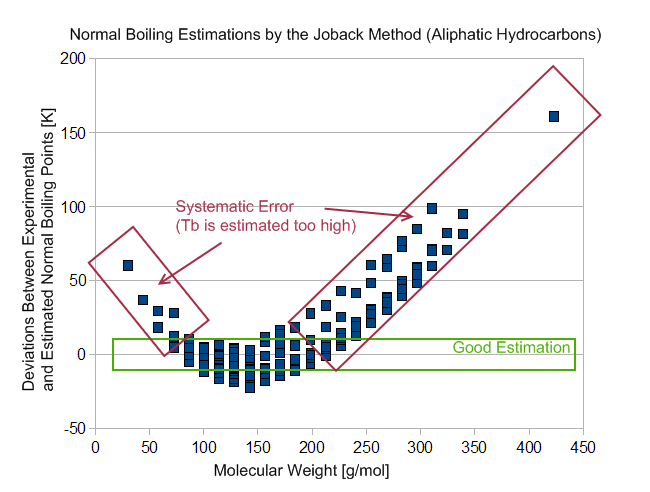
English: Diagram shows the deviations between predicted normal boiling points (Joback method) and experimental data taken from the Dortmund Data Bank. English Descriptions.
Deutsch: Diagramm zeigt die Abweichungen zwischen abgeschätzten Normalsiedepunkten (Joback-Methode) und experimentellen Datenpunkten aus der Dortmunder Datenbank. Englische Beschriftung. |
| Date | |
| Source | Own work |
| Author | WilfriedC |
Licensing
I, the copyright holder of this work, hereby publish it under the following license:
This file is licensed under the Creative Commons Attribution-Share Alike 3.0 Unported license.
- You are free:
- to share – to copy, distribute and transmit the work
- to remix – to adapt the work
- Under the following conditions:
- attribution – You must give appropriate credit, provide a link to the license, and indicate if changes were made. You may do so in any reasonable manner, but not in any way that suggests the licensor endorses you or your use.
- share alike – If you remix, transform, or build upon the material, you must distribute your contributions under the same or compatible license as the original.
copyright status
copyrighted
copyright license
Creative Commons Attribution-ShareAlike 3.0 Unported
source of file
original creation by uploader
inception
2 June 2008
File history
Click on a date/time to view the file as it appeared at that time.
| Date/Time | Thumbnail | Dimensions | User | Comment | |
|---|---|---|---|---|---|
| current | 18:21, 2 June 2008 | | 650 × 492 (36 KB) | WilfriedC | {{Information |Description={{en|1=Diagram shows the deviations between predicted normal boiling points (Joback method) and experimental data taken from the Dortmund Data Bank. English Descriptions.}} {{de|1=Diagramm zeigt die Abweichungen zwischen abgesch |
File usage
The following page uses this file:
Global file usage
The following other wikis use this file:
- Usage on fr.wikipedia.org
- Usage on it.wikipedia.org